I was overwhelmed by the power of the graylog2 web interface, after the backend switched to elasticsearch. With custom fields in the gelf message holding valuable data and elasticsearch providing the right kind of search capabilities, its up to the imagination of users on what could be achieved.
Let me take you through a overview of how we could use graylog2 web interface. The rest of the blog assumes, that you have read the previous blog on logstash and graylog.
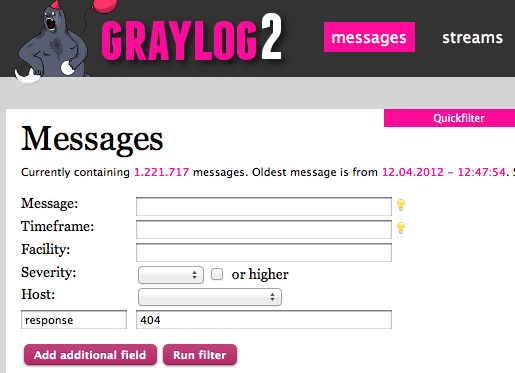
Armed with custom fields, lets take a common scenario where we want to quickly find out broken urls. We can login to the graylog2 web interface. Once logged in, there will be the messages tab that will be highlighted by default and it shows quick filter.
Now click on the ‘quickfilter‘ option. Select ‘Add additional field‘ from the expanded options.
Enter ‘_response‘ in the first text box and the value ‘404‘ in the next text box. Now hit ‘Run filter’. There you go, the list of all broken urls. You can select the message from the result and on the right side shows the details of the message.
Each of the fields value is clickable, that means you can quickly filter out all the messages with that value. For example, you have found that a old url is hit and it has returned 404. Just select the value in the field request and you will be taken to the results page which lists all messages with the same request url.
You want to know the referrers for all the requests which has this url. We can use the analytics shell to figure this out.
all.distribution({_httpreferrer}, _request = "/old_url")
We would typically go to the analytics tool like Google Analytics to figure out, what browsers were used to reach the site and the number of requests for each of these browsers. This can be mined from the log itself by using the analytics shell with a simple query:
all.distribution({_httpuseragent})
Similarly to find the incoming referral urls and the request count per referral url we can use something like:
all.distribution({_httpreferrer})
With the graylog custom fields we have defined in the previous post, we can find the rendering time for a rails view template, time taken for a rails action, etc.. We could easily enhance it to add fields for queries and their execution time. If that is done, the log can provide vital clues into application performance and behavior of the user.
Just to give a idea of the power that is available, let me quote a real incident. We had a interesting user, who entered a secret information in the designated field, but reported that the private info is compromised and it is shown in another public field. We were clueless how on earth, this could occur. Finally, log mining came to our rescue. we figured out all the requests from that day by that user and then used the rails unique request id of each of these requests and got all the logs. we matched the httpreferrer of a particular request with the request field of other requests, by which we got the exact user flow in the application. Once that is done, we replicated the exact scenario and found that, when a validation error occurs, the focus was not set properly. This debugging was a very simple exercise, since we were able to map the exact user journey in the application. Other wise it would have been a daunting task to figure out what was happening.
From here on, its just about imagination about how much value you want to derive out of your logs and how you want that achieved. The tools are available right at your doorsteps.
After using the tool extensively, there is only one request to graylog team, to look at providing a plugin architecture for the graylog web interface for extension. Also planning to work on Graylog web ui to give some more power and customization capabilities, when time permits.
In case of questions, pls do reach out through twitter or through comments.


